For readers with a background in high school mathematics or statistics, the most recognized probability distribution is the normal distribution, which describes how an independent variable behaves under the influence of random factors after repeated trials. However, the log-normal distribution, characterized by its long tail, is more commonly observed in the brain.
What biological mechanisms give rise to the log-normal distribution? How does the brain utilize this distribution across different scales—from cellular to perceptual—to support its complex functions? How does the brain's adherence to this distribution pattern enable efficient computation and inspire advancements in artificial intelligence? This article will review foundational theories and several subsequent studies in an attempt to answer these questions.
1. Normal Distribution vs. Log-Normal Distribution
What is a log-normal distribution? To grasp this concept, imagine participating in a virtual stock market simulation game. At the start of the game, each player has the same initial capital. Players must buy and sell stocks daily based on random market fluctuations. The decisions and luck of each player determine their gains or losses. On the first day, the distribution of players' gains and losses will follow a normal distribution, with a few players experiencing significant losses, a few others achieving substantial gains, and most falling somewhere in between with minor gains or losses.
However, over time, you'll notice that although the daily fluctuations are random (with each decision’s outcome following a normal distribution), the final distribution of each player’s capital becomes skewed and long-tailed. This is the log-normal distribution.
Because the player’s capital changes based on their previous balance, a cumulative effect takes place. As a result, most players’ capital tends to cluster at lower levels. Those who consistently break even or incur small losses over time will see their capital stabilize at lower amounts. Conversely, a very small number of players will accumulate significant wealth as consistent winners continue to gain more, resulting in a long-tailed distribution*.
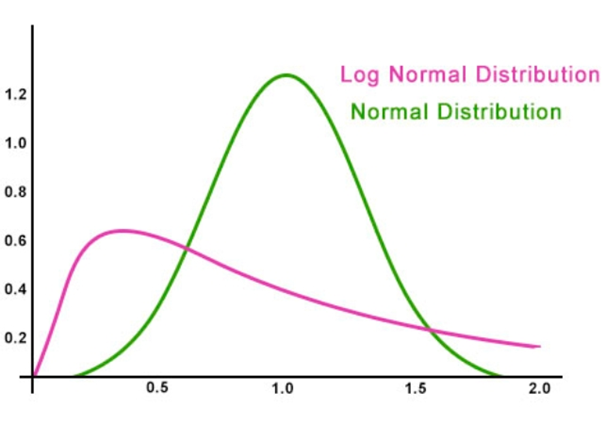
▷ Fig.1. A comparison of normal distribution (green) and log-normal distribution (red). The compares the normal distribution (green) and the log-normal distribution (red). In the stock market example, the horizontal axis represents capital, and the vertical axis represents the number of players. In the case of neurons, the horizontal axis represents activation frequency, and the vertical axis represents the number of neurons. In the stock market example, because each player's capital changes by a fixed percentage (e.g., increasing or decreasing by 50%) based on their previous balance with each trade, only a very small portion of players consistently lose (e.g., from 100 to 50 to 25 to 12.5 to 6.25), while a few consistently win (e.g., from 100 to 150 to 225 to 337.5). Most players fall somewhere in between, fluctuating between gains and losses (e.g., 100 to 150 to 75 to 112.5 to 56.25; 100 to 50 to 75 to 37.5 to 56.25), with the majority clustering at lower values.
In academic circles, random variables following a log-normal distribution are often described using terms like power law or scale-free, all referring to the same underlying phenomenon.
2. Log-Normal Distributions in Neuronal Activations, Dendritic Spine Sizes, and Synaptic Densities
In the brain, the behavior of neurons is analogous to the lights in a city. Most of the lights remain off, but occasionally, a small number turn on, illuminating the surrounding area. Multiple studies have demonstrated that these intervals of 'illumination,' reflected in the firing rates of neurons, follow a log-normal distribution pattern [1]. This pattern is consistent across different species, including mice and humans. It is observed in both excitatory pyramidal neurons and inhibitory interneurons and is evident in brain regions ranging from the evolutionarily primitive cerebellum to the neocortex, which is responsible for higher cognitive functions.
The asymmetry of the log-normal distribution means that a small portion of neurons in the brain are frequently active, while the majority remain relatively idle, only occasionally activating. Moreover, the amplitude of neuronal firing spikes and the weights of synapses also follow a log-normal distribution [1].
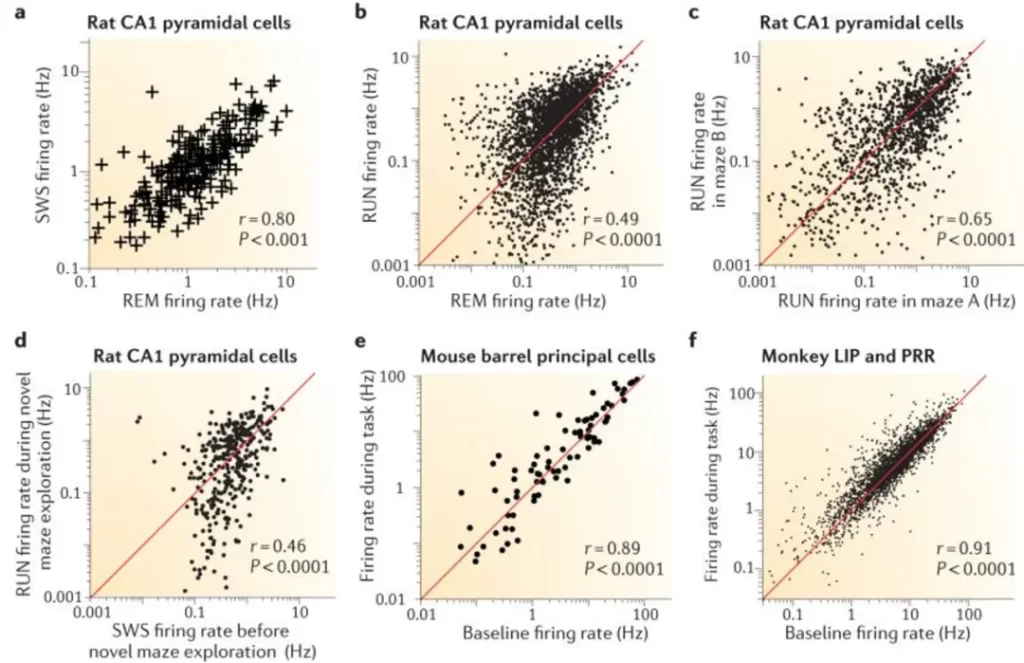
▷ Fig.2. In various brain regions and environments, the firing rates of common types of neurons follow a log-normal distribution (both the horizontal and vertical axes have been logarithmically transformed, resulting in a linear scatter plot). Source: Reference 1.
However, neurons do not simply 'turn on' or 'off.' Closer examination of their structure reveals spiny protrusions on dendritic branches known as dendritic spines. A single neuron may contain hundreds of dendritic spines, varying in size. These spines undergo plasticity during neuronal development and play critical roles in information storage and computation.
A study observed that in the auditory cortex of mice, the sizes of dendritic spines also follow a log-normal distribution (Fig.3). Furthermore, the magnitude of their changes is proportional to their original size, resembling the fluctuations in stock market capital: the larger the investment, the greater the fluctuation.
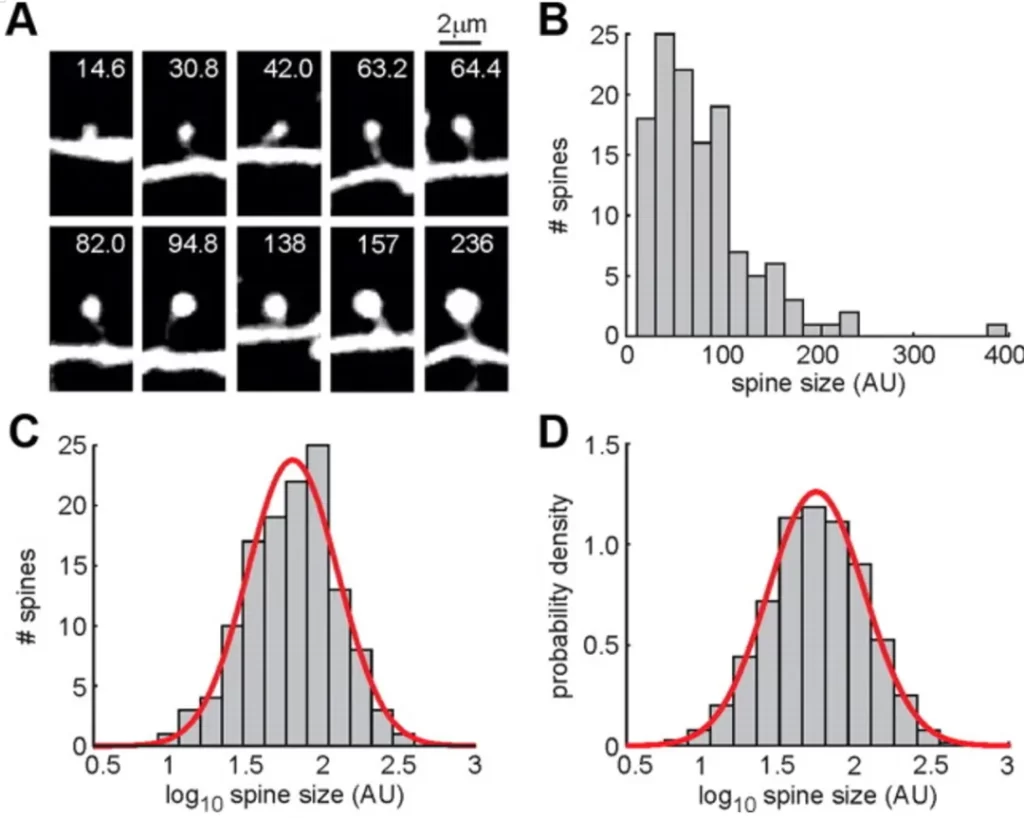
▷ Fig.3. The sizes of dendritic spines follow a log-normal distribution. A: Schematic of a dendritic spine, B: Raw probability distribution, C, D: Log-transformed number of dendritic spines and probability distribution on the X-axis.
The above analysis is based on recordings from individual neurons. However, with advances in connectomics, researchers can now map networks composed of neurons within specific regions. For example, a study of nine mammalian species [3] found that in seven of these species, neuronal density (the number of neurons per cubic millimeter) in the cerebral cortex follows a log-normal distribution (Fig.4). This suggests that the log-normal distribution is a fundamental principle of the macroscopic organization of the nervous system and should be considered a constraint when designing neuromorphic hardware.

▷ Fig.4. Distribution of neuronal densities across nine mammalian species. The degree of deviation is shown, with the two species that do not follow the log-normal distribution (GALAGO and OWL MONKEY) possibly due to uneven sampling and insufficient sample size. Source: Reference 3.
3. Is It True That We Only Use 10% of Our Brain?
The popular myth that we only use 10% of our brain arises from a fundamental misunderstanding of how brain activity is distributed. Brain activity is not uniformly distributed; rather, it exhibits a 'long-tail' characteristic, with a small number of neurons being highly active while the majority are less active. The distribution of neuronal firing rates is often attributed to the complex interconnectedness of neurons [1].
(1) Interactions Between Neurons
Let's use the analogy of a large symphony orchestra to better understand this concept. In a symphony orchestra, each musician has their own instrument and plays at their own rhythm. During a performance, not all musicians play simultaneously. Instead, depending on the composition, some musicians play more actively, creating the music's climax, while others may rest, waiting for their next cue. This uneven activity pattern mirrors the activation states of neurons in the brain: most neurons are relatively "quiet" most of the time, but a small, ever-changing group of active neurons drives the brain's complex thinking and perception tasks.
The scientific basis for this activity pattern is that interactions between neurons are not merely additive but cumulative, much like the harmonious coordination and mutual stimulation among musicians, involving complex regulation and feedback mechanisms. For example, in certain situations, the activity of one neuron may prompt other closely connected neurons to become active, forming a "hotspot" of activity. This phenomenon across the entire neural network results in a log-normal distribution pattern.
In addition to explaining cumulative effects through neuronal connectivity, some studies use the "Integrate-and-Fire Model" to demonstrate that even individual neurons can exhibit a log-normal distribution in firing rates due to internal cumulative adjustments (such as the compounding errors in membrane potential discharge) [4].
(2) Hebbian Theory
Hebbian theory, which describes the self-organization of neurons, offers another explanation for the log-normal distribution observed in the nervous system [5]. Similar to relationships in a social network, neurons that frequently activate together form stronger connections. Whether in simple organisms like C. elegans or more complex species like fruit flies and mice, the number and density of neuronal connections exhibit a scale-free, long-tail characteristic—most connections are weak, while a few are very strong.
The theoretical predictions of these models align with experimental results. Enhancing connections between co-activated neurons—including direct first-order connections and second- and third-order indirect connections (Fig.5a)—reproduces the actual distribution of connection strengths observed (solid line in Fig.5b). This suggests that the modularity of the nervous system arises from the generative mechanisms of the network rather than the specificity of species or neurons, further explaining the ubiquity of log-normal probability distributions.
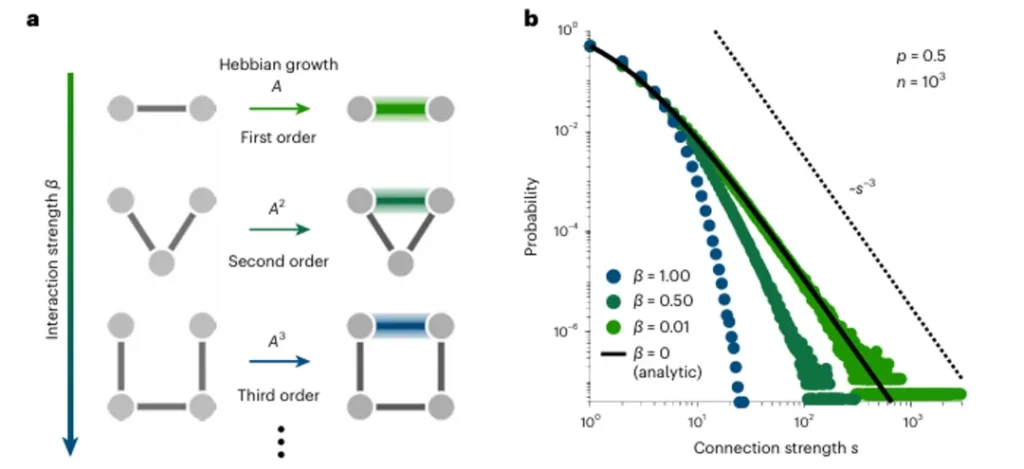
▷ Fig.5. Hebbian theory-based explanation of the scale-free nature of neural activity.
(3) Energy Consumption and Evolutionary Perspective
From the perspective of reducing brain energy consumption and signal transmission distance, the log-normal distribution is advantageous [6]. Specifically, this is achieved by clustering a small number of neurons in a certain area to form a modular "rich club" and having a few neurons frequently activate. Therefore, modularity and the frequent activation of a small number of computational units should be guiding principles for designing neuromorphic computing systems.
Evolutionarily, a ready group of neurons with dense connections and rapid activation can be seen as a core system within the brain, always prepared to act swiftly, which is crucial for species survival. However, the full functionality of the brain depends on another system provided by the majority of neurons with sparse connections and infrequent activation. These neurons participate less in daily activities but are crucial when adapting to new or uncommon stimuli.
Thus, instead of saying we use only 10% of our brain, we should understand that only 10% of the brain is actively working at any given moment. This reflects an optimal balance achieved by the brain to handle both common and uncommon stimuli across multiple timescales, a characteristic of the brain's criticality [7].
(4) Other Explanations
In addition to the models mentioned above, another explanation for the log-normal distribution in the nervous system [8] considers two different types of neurons. This model divides neurons into two categories: one that remains silent due to excessive "silent" signals (inhibitory neuron influence), and another that becomes highly active due to "volume increase" (excitatory neuron influence). The model assumes that the initial signals received by all neurons are uniformly distributed, like evenly distributed sounds. However, as these signals accumulate within neurons, those more influenced by excitatory signals amplify them, resulting in their activity output following a log-normal distribution.
This model not only explains how the balance between excitation and inhibition shapes neural responses but also clarifies how the nervous system maintains sensitivity to small signals while avoiding overreaction to excessively strong inputs.

▷ Fig.6. Log-normal distribution among neurons due to nonlinear gain effects.
Moreover, a model proposed by Per Bak in his book How Nature Works offers another perspective, known as the "critical sandpile model." In this model, the accumulation and collapse of sand grains resemble the dynamic changes in neural networks: as the sandpile grows, small collapses occur frequently, while large collapses, requiring more accumulated sand, are rarer.
Scientists, through studying the physical and mechanical properties of the cytoskeleton [9], have discovered that the aggregation and fragmentation behaviors of neurons resemble the collapse of a sandpile. This process leads to the distribution of neuronal density also exhibiting a log-normal distribution, which explains the uneven phenomenon in neural networks where a "few neurons are highly active while the majority remain silent."

▷ How Nature Works by Per Bak.
4. Conclusion: What Is the Value of Examining the Statistical Characteristics of the Nervous System?
Thoroughly analyzing the statistical characteristics of the nervous system allows researchers to uncover universal principles that span different species and brain regions, while also exploring how these features change under various environmental stimuli.
For example, a study on rhesus monkeys found that neuronal firing rates follow a log-normal distribution when exposed to both familiar and unfamiliar visual stimuli [10]. However, the statistical properties of these firing rates differ depending on the familiarity of the environment. When viewing unfamiliar images, the long-tail feature of the distribution becomes more pronounced, with an increase in variance (Fig.8). This suggests that neurons become more actively engaged when processing novel stimuli, while in familiar settings, the brain relies on pre-established modules.
However, this study only considered neuronal connections and did not account for the role of dendritic spines, which also play a part in storage and computation. It is possible that, when faced with familiar stimuli, the nervous system opts for less energy-intensive local changes in dendritic spines to maintain plasticity. This hypothesis awaits further research. Similar research approaches could compare the probability distribution of neuronal density across different brain regions and explore potential differences based on mechanical, genetic, or gene expression factors during development.
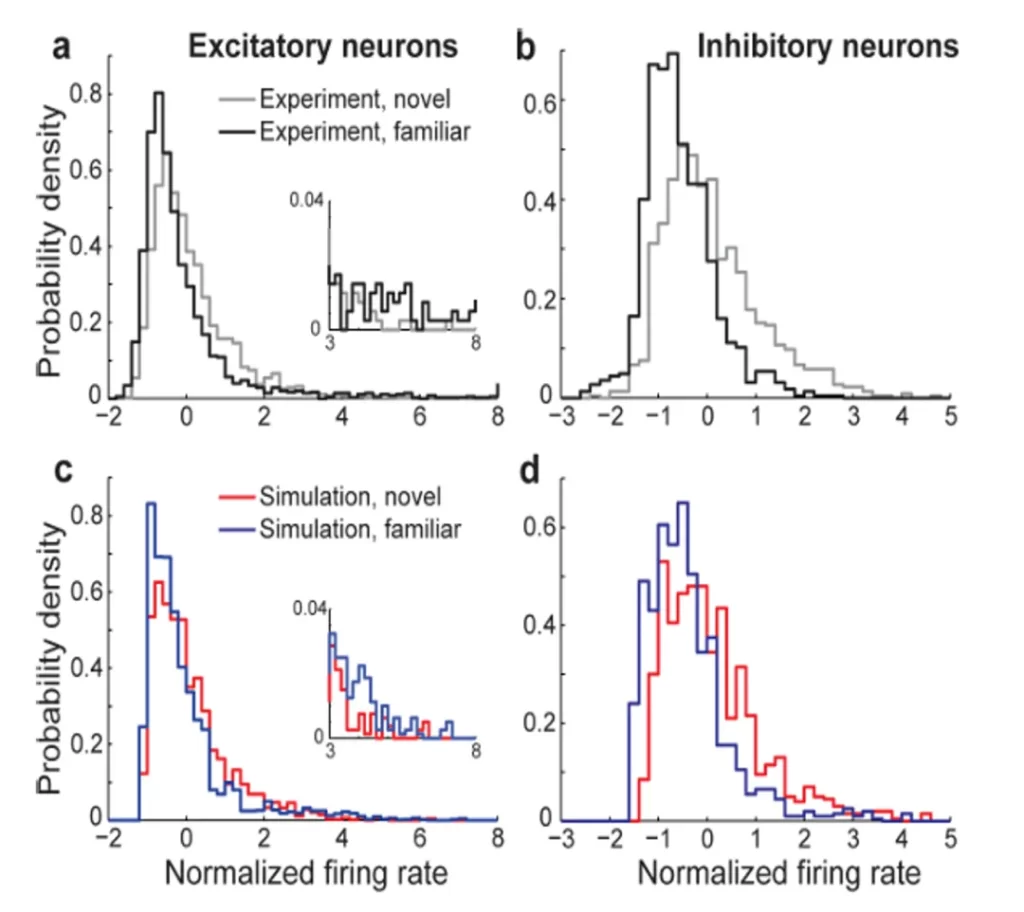
▷ Fig.8. Theoretical and actual probability distributions of neuronal firing rates in rhesus monkeys in response to familiar and unfamiliar stimuli.
A well-known example of the log-normal distribution in the nervous system is the concept of a "neuronal avalanche," where neural activity experiences brief bursts lasting tens of milliseconds, followed by a few seconds of quiescence. Neuronal avalanches are closely related to the brain's ability to store, transmit, and compute information, as well as its sparsity and stability. They are among the fundamental constraints to consider when designing neuromorphic computing systems. For example, the "Thousand Brains Theory" proposed for cortical column computation—whether its model can reproduce the log-normal distribution described here—could be a criterion for its success.
Various models based on different assumptions have been developed to explain the mechanisms behind the log-normal distributions observed in the nervous system. Many of these models can fit real data. It is likely that each model captures a particular aspect of the true nature of the nervous system, but the actual pattern of neural activity may result from a combination of these mechanisms.
From a broader perspective, the log-normal distribution observed in the nervous system reflects its inherent heterogeneity and serves as the foundation for robust learning and energy-efficient computation in the brain. Although terms like "power law," "scale-free," and "neuronal avalanche" describe different aspects of these distributions, they fundamentally point to the same complex biological logic. This article provides only an overview of the relevant research; readers interested in these topics can delve further into the references, particularly Reference 1.
As observed in the stock market simulation game, the brain's operating patterns bear a notable resemblance to many phenomena in our daily lives, all following certain fundamental mathematical laws. From the micro-level responses of individual neurons to the macro-level dynamics of entire neural networks, the brain utilizes log-normal distributions to optimize information processing, conserve energy, and enhance its adaptability to the external world. This mathematical essence raises the question of whether long-tail distributions and neuronal avalanches, produced by self-organizing processes, can also be observed in artificial neural networks. Do the activation rates in Transformers also follow a log-normal distribution?